 Tutorials
 PPTs
PPTs Lecture Notes
 Objective Questions
 Lab Programs
Predictive Analytics - (LAB PROGRAMS)
Aim:
☛
Ward's Method of Clustering
Solution :
Library Installation:
To install required library files, Open Command Prompt or Terminal and execute the following commands
$ pip install scipy

$ pip install scikit-learn

$ pip install numpy

$ pip install matplotlib
PROGRAM: (WARDS.py)
import pandas as pd
import matplotlib.pyplot as plt
from sklearn.preprocessing import StandardScaler
from scipy.cluster.hierarchy import linkage, dendrogram, fcluster

# Sample dataset
data = {
    'Feature 1': [0.59, 1.23, -2.35, -2.10, 0.85, 1.50, -1.90, 2.10, 0.75, -2.50],
    'Feature 2': [2.02, 1.80, 8.45, 8.10, 2.30, 1.60, 8.70, 1.20, 2.10, 8.90]
}

df = pd.DataFrame(data)

# Standardize the data
scaler = StandardScaler()
X_scaled = scaler.fit_transform(df)

# Apply Ward's Hierarchical Clustering
linked = linkage(X_scaled, method='ward')

# Plot Dendrogram
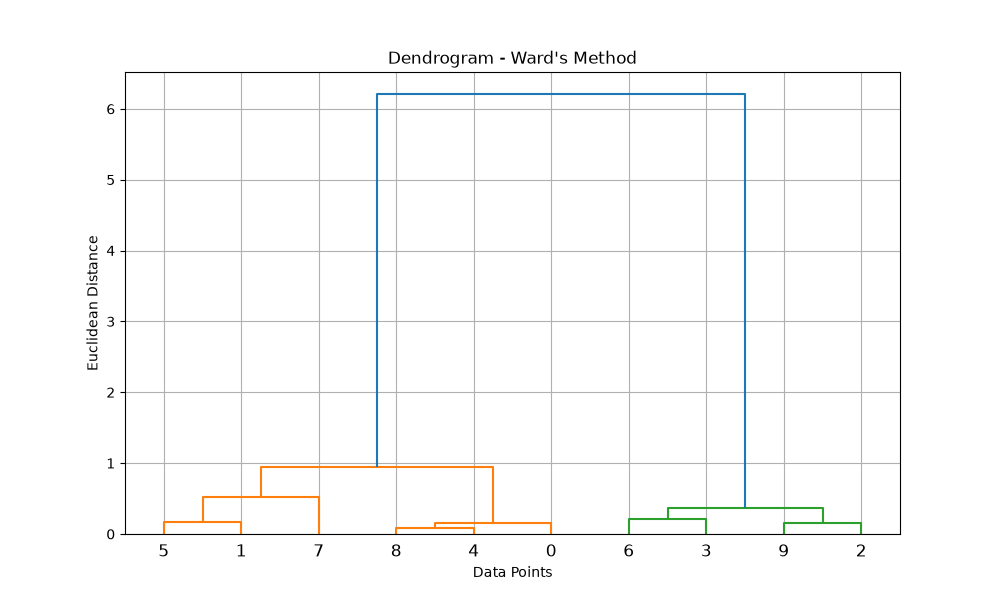
plt.figure(figsize=(10,6))
dendrogram(
    linked,
    orientation='top',
    distance_sort='descending',
    show_leaf_counts=True
)

plt.title("Dendrogram - Ward's Method")
plt.xlabel("Data Points")
plt.ylabel("Euclidean Distance")
plt.grid(True)
plt.show()

# Assign Cluster Labels (3 clusters)
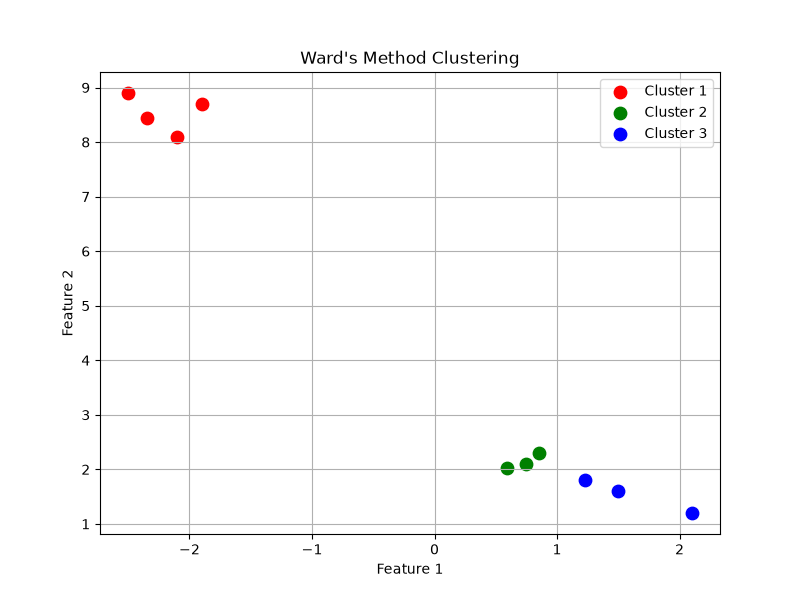
clusters = fcluster(linked, t=3, criterion='maxclust')

# Scatter Plot
plt.figure(figsize=(8,6))

colors = ['red', 'green', 'blue']

for i in range(1, 4):
    plt.scatter(
        df['Feature 1'][clusters == i],
        df['Feature 2'][clusters == i],
        color=colors[i-1],
        s=80,
        label=f'Cluster {i}'
    )

plt.title("Ward's Method Clustering")
plt.xlabel("Feature 1")
plt.ylabel("Feature 2")
plt.legend()
plt.grid(True)
plt.show()

# Clustered Data Table
clustered_data = df.copy()
clustered_data['Cluster'] = clusters

print("\nClustered Data Table")
print(clustered_data)
OUTPUT:
Clustered Data Table
   Feature 1  Feature 2  Cluster
0       0.59       2.02        2
1       1.23       1.80        3
2      -2.35       8.45        1
3      -2.10       8.10        1
4       0.85       2.30        2
5       1.50       1.60        3
6      -1.90       8.70        1
7       2.10       1.20        3
8       0.75       2.10        2
9      -2.50       8.90        1
Related Content :
1. Simple Linear regression. View Solution
2. Multiple Linear regression. View Solution
3. Logistic Regression. View Solution
4. CHAID. View Solution
5. CART. View Solution
6. ARIMA - stock market data. View Solution
7. Exponential Smoothing. View Solution
8. Hierarchical clustering. View Solution
9. Ward's method of clustering. View Solution
10. Crowdsource predictive analytics- Netflix data. View Solution