Creating Three-Dimensional Plots
R provides several functions for creating 3D plots. The persp() and wireframe() functions are used to plot data in three dimensions.
Example: using wireframe()
> library(lattice)
> a <- 1:10
> b <- 1:15
> eg <- expand.grid(x=a, y=b)
> eg$z <- eg$x^2 + eg$x * eg$y
> wireframe(z ~ x+y, eg)
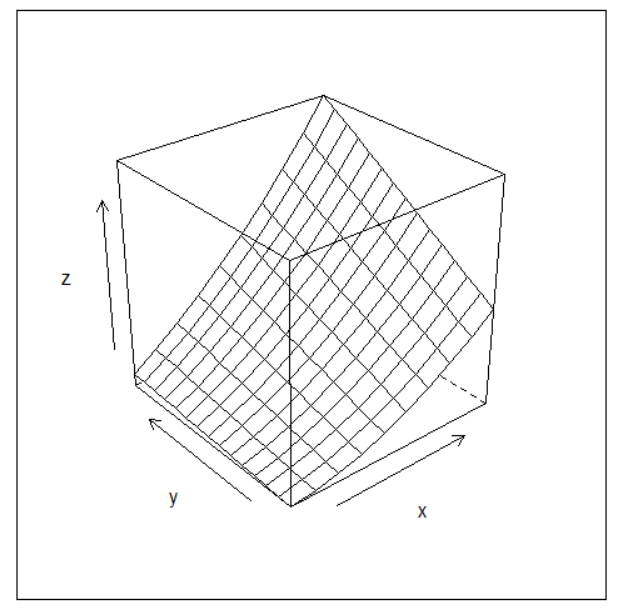
In the above example, first we load the lattice library. Then the call to expand.grid() creates a data frame, consisting of two columns named x and y, in all possible combinations of the values of the two inputs. Here, a and b had 10 and 15 values, respectively, so the resulting data frame will have 150 rows.
We then added a third column, named z, as a function of the first two columns. The arguments, given in regression model form, specify that z is to be graphed against x and y.
Example: using persp()
> # Create x and y values
> x <- 1:10
> y <- 1:15

> # Create a matrix of z values based on x and y
> z <- outer(x, y, function(x, y) x^2 + x * y)

> # Make the 3D plot
> persp(x, y, z, main = "3D Plot of x^2 + x * y",
        xlab = "X", ylab = "Y", zlab = "Z")
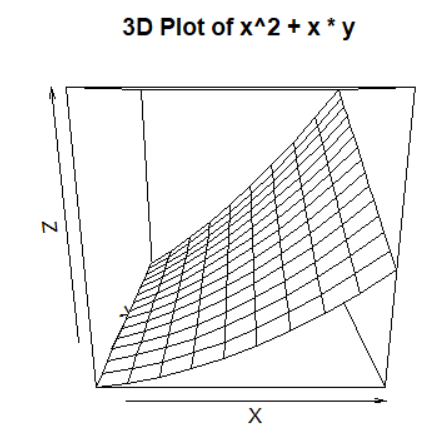
While using the persp() and wireframe() functions, all the points are connected as a surface (like connecting points by lines in two dimensions). In contrast, with cloud(), the points are isolated.